[1]:
%run ../initscript.py
import pandas as pd
import numpy as np
import matplotlib.pyplot as plt
from ipywidgets import *
%matplotlib inline
Kernel Methods
[5]:
import sys
sys.path.append('Modules')
from DesignMat import Polynomial, Gaussian, Sigmoidal

np.random.seed(1234)
def sinusoidal(x):
    return np.sin(2 * np.pi * x)

def create_data(func, sample_size, std, domain=[0, 1]):
    x = np.linspace(*domain, sample_size)
    np.random.shuffle(x)
    t = func(x) + np.random.normal(scale=std, size=x.shape)
    return x, t

def kernel(x, y, param = [1, 15, 0, 0], pairwise=True):
    if pairwise:
        x, y = (np.tile(x, (len(y), 1)).transpose(1, 0), np.tile(y, (len(x), 1)))
    return param[0] * np.exp(-0.5 * param[1] * (x - y) ** 2) + param[2] + param[3] * np.multiply(x, y)
[10]:
def equiv_kernel(func, x_train, x):
    beta = 100  # large beta gives better result, especially for polynomial basis
    phi = func.dm(x_train)
    K = phi.dot(phi.T) # Gram matrix
    return np.linalg.inv(np.eye(x_train.shape[0]) / beta + K).dot(phi.dot(func.dm(x).T)) # see (6.9)

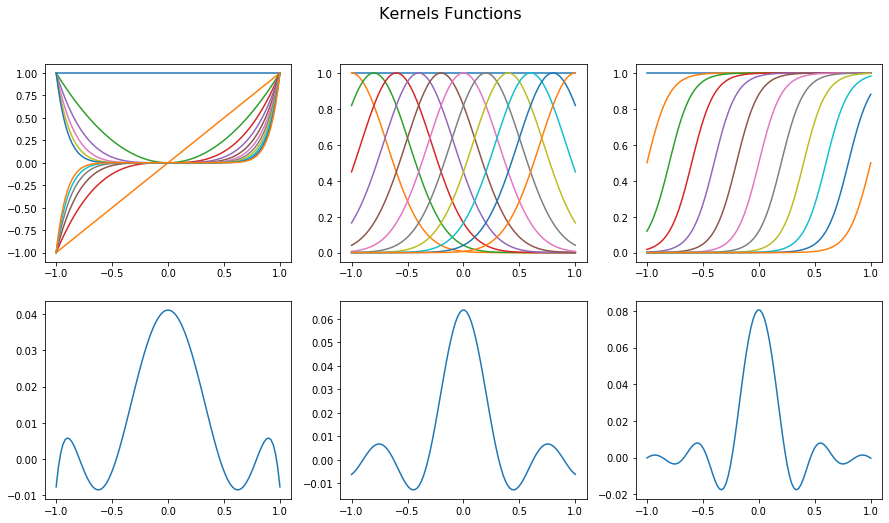
funcs = {'Polynomial': [11], 'Gaussian': [np.linspace(-1, 1, 11), 0.1],'Sigmoidal': [np.linspace(-1, 1, 11), 10]}

x = np.linspace(-1, 1, 100)
x0 = np.array([0])

plt.figure(figsize=(15, 8))
plt.suptitle('Kernels Functions', fontsize=16)
for i, (key, value) in enumerate(funcs.items()):
    plt.subplot(2, 3, i + 1)
    phi = globals()[key](*value).dm(x)
    for j in range(12):
        plt.plot(x, phi[:, j])
    plt.subplot(2, 3, i + 4)
    y = equiv_kernel(globals()[key](*value), x, x0)
    plt.plot(x, y)


x_train, t_train = create_data(sinusoidal, 10, 0.25)
x_test = np.linspace(0, 1, 100)
t_test = sinusoidal(x_test)

fig = plt.figure(figsize=(12, 8))
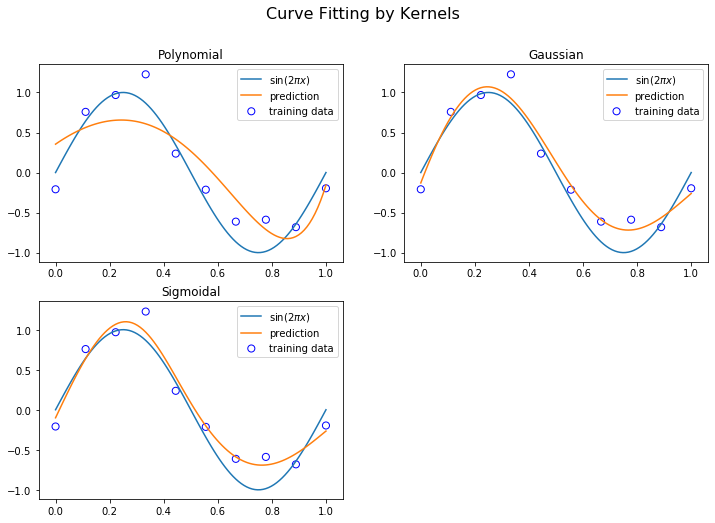
plt.suptitle('Curve Fitting by Kernels', fontsize=16)
for i, (key, value) in enumerate(funcs.items()):
    y = equiv_kernel(globals()[key](*value), x_train, x_test)
    t = y.T.dot(t_train)
    plt.subplot(2, 2, i+1)
    plt.scatter(x_train, t_train, facecolor="none", edgecolor="b", s=50, label="training data")
    plt.title(key)
    plt.plot(x_test, t_test, label="$\sin(2\pi x)$")
    plt.plot(x_test, t, label="prediction")
    plt.legend()
plt.show()
Gaussian Process for Regression
\begin{align*} C_n = \frac{1}{\alpha} \Phi \Phi^\intercal + \frac{1}{\beta} \textrm{I}_n \end{align*}
\begin{align*} (\textrm{I} + AB)^{-1} A = A (\textrm{I} + BA)^{-1} \end{align*}
\begin{align*} \Phi^{\intercal} (\alpha^{-1} \Phi \Phi^\intercal + \beta^{-1} \textrm{I}_n)^{-1} = \alpha \beta (\beta \Phi^\intercal \Phi + \alpha \textrm{I}_m)^{-1} \Phi^\intercal = \alpha \beta S_{n} \Phi^{\intercal} \end{align*}
\begin{align*} \textbf{m}_{n+1} &= \alpha^{-1} \phi(x_{n+1})^\intercal \Phi^{\intercal} (\alpha^{-1} \Phi \Phi^\intercal + \beta^{-1} \textrm{I}_n)^{-1} \mathbf{t} \\ & = \beta \phi(x_{n+1})^\intercal S_{n} \Phi^{\intercal} \mathbf{t} \end{align*}
[6]:
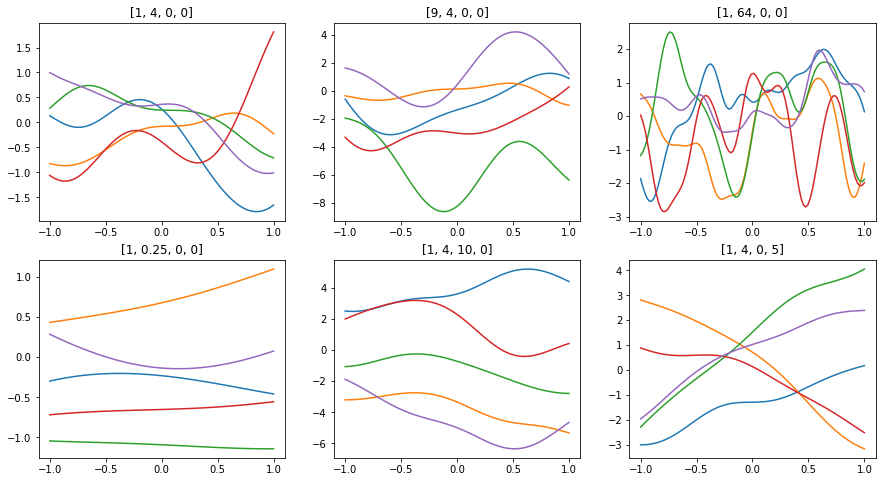
x = np.linspace(-1, 1, 100)
params = [[1, 4, 0, 0],
          [9, 4, 0 , 0],
          [1, 64, 0, 0],
          [1, 0.25, 0, 0],
          [1, 4, 10, 0],
          [1, 4, 0, 5]]

plt.figure(figsize=(15, 8))
for n in range(len(params)):
    plt.subplot(2, 3, n+1)
    plt.gca().set_title("{}".format(params[n]))
    y = np.random.multivariate_normal(np.zeros(len(x)), kernel(x, x, params[n]), 5)
    for i in range(5):
        plt.plot(x, y[i], label=params[0])
plt.show()
[7]:
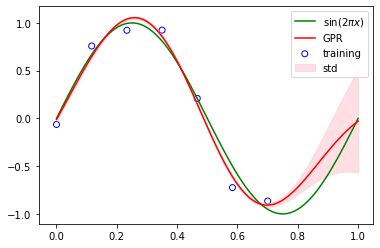
np.random.seed(1234)
x_train, t_train = create_data(sinusoidal, 7, std=0.1, domain=[0., 0.7])
x = np.linspace(0, 1, 100)

beta = 100
I = np.eye(len(x_train))

Gram = kernel(x_train, x_train)
K = kernel(x, x_train)
covariance = Gram + I / beta # (6.62)
precision = np.linalg.inv(covariance)
t = K @ precision @ t_train  # (6.66)
t_std = kernel(x, x, pairwise=False) + 1 / beta - np.sum(K @ precision * K, axis=1)  # (6.67)

plt.scatter(x_train, t_train, facecolor="none", edgecolor="b", color="blue", label="training")
plt.plot(x, sinusoidal(x), color="g", label="sin$(2\pi x)$")
plt.plot(x, t, color="r", label="GPR")
plt.fill_between(x, t - t_std, t + t_std, alpha=0.5, color="pink", label="std")
plt.legend()
plt.show()
[8]:
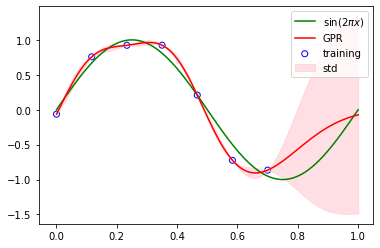
from sklearn.gaussian_process import GaussianProcessRegressor
from sklearn.gaussian_process.kernels import RBF, ConstantKernel

kernel = ConstantKernel(1) * RBF(1/np.sqrt(15), (1e-2, 1e2))
gp = GaussianProcessRegressor(kernel=kernel)
gp.fit(x_train.reshape(-1,1), t_train)

t, t_std = gp.predict(x.reshape(-1,1), return_std=True)
plt.scatter(x_train, t_train, facecolor="none", edgecolor="b", color="blue", label="training")
plt.plot(x, sinusoidal(x), color="g", label="sin$(2\pi x)$")
plt.plot(x, t, color="r", label="GPR")
plt.fill_between(x, t - 2*t_std, t + 2*t_std, alpha=0.5, color="pink", label="std")
plt.legend()
plt.show()
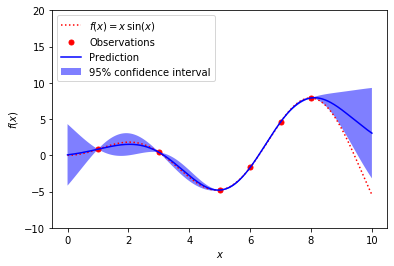
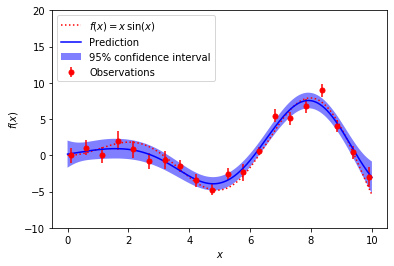
A simple one-dimensional regression example computed in two different ways:
A noise-free case
A noisy case with known noise-level per datapoint
In both cases, the kernel’s parameters are estimated using the maximum likelihood principle.
The figures illustrate the interpolating property of the Gaussian Process model as well as its probabilistic nature in the form of a pointwise 95% confidence interval.
Note that the parameter alpha is applied as a regularization of the assumed covariance between the training points.
[9]:
import numpy as np
import matplotlib.pyplot as plt
%matplotlib inline

from sklearn.gaussian_process import GaussianProcessRegressor
from sklearn.gaussian_process.kernels import RBF, ConstantKernel as C

np.random.seed(123)

def f(x):
    """The function to predict."""
    return x * np.sin(x)

# ----------------------------------------------------------------------
#  First the noiseless case
X = np.atleast_2d([1., 3., 5., 6., 7., 8.]).T

# Observations
y = f(X).ravel()

# Mesh the input space for evaluations of the real function, the prediction and
# its MSE
x = np.atleast_2d(np.linspace(0, 10, 1000)).T

# Instantiate a Gaussian Process model
kernel = C(1.0, (1e-3, 1e3)) * RBF(10, (1e-2, 1e2))
gp = GaussianProcessRegressor(kernel=kernel, n_restarts_optimizer=9)

# Fit to data using Maximum Likelihood Estimation of the parameters
gp.fit(X, y)

# Make the prediction on the meshed x-axis (ask for MSE as well)
y_pred, sigma = gp.predict(x, return_std=True)

# Plot the function, the prediction and the 95% confidence interval based on
# the MSE
plt.figure()
plt.plot(x, f(x), 'r:', label=u'$f(x) = x\,\sin(x)$')
plt.plot(X, y, 'r.', markersize=10, label=u'Observations')
plt.plot(x, y_pred, 'b-', label=u'Prediction')
plt.fill(np.concatenate([x, x[::-1]]),
         np.concatenate([y_pred - 1.9600 * sigma,
                        (y_pred + 1.9600 * sigma)[::-1]]),
         alpha=.5, fc='b', ec='None', label='95% confidence interval')
plt.xlabel('$x$')
plt.ylabel('$f(x)$')
plt.ylim(-10, 20)
plt.legend(loc='upper left')

# ----------------------------------------------------------------------
# now the noisy case
X = np.linspace(0.1, 9.9, 20)
X = np.atleast_2d(X).T

# Observations and noise
y = f(X).ravel()
dy = 0.5 + 1.0 * np.random.random(y.shape)
noise = np.random.normal(0, dy)
y += noise

# Instantiate a Gaussian Process model
gp = GaussianProcessRegressor(kernel=kernel, alpha=dy ** 2,
                              n_restarts_optimizer=10)

# Fit to data using Maximum Likelihood Estimation of the parameters
gp.fit(X, y)

# Make the prediction on the meshed x-axis (ask for MSE as well)
y_pred, sigma = gp.predict(x, return_std=True)

# Plot the function, the prediction and the 95% confidence interval based on
# the MSE
plt.figure()
plt.plot(x, f(x), 'r:', label=u'$f(x) = x\,\sin(x)$')
plt.errorbar(X.ravel(), y, dy, fmt='r.', markersize=10, label=u'Observations')
plt.plot(x, y_pred, 'b-', label=u'Prediction')
plt.fill(np.concatenate([x, x[::-1]]),
         np.concatenate([y_pred - 1.9600 * sigma,
                        (y_pred + 1.9600 * sigma)[::-1]]),
         alpha=.5, fc='b', ec='None', label='95% confidence interval')
plt.xlabel('$x$')
plt.ylabel('$f(x)$')
plt.ylim(-10, 20)
plt.legend(loc='upper left')

plt.show()
