[1]:
%run ../initscript.py
HTML("""
<div id="popup" style="padding-bottom:5px; display:none;">
    <div>Enter Password:</div>
    <input id="password" type="password"/>
    <button onclick="done()" style="border-radius: 12px;">Submit</button>
</div>
<button onclick="unlock()" style="border-radius: 12px;">Unclock</button>
<a href="#" onclick="code_toggle(this); return false;">show code</a>
""")
[1]:
Exploring Data
Data and information are so prevalent in our lives today, that it is known as the “Information Age”. Being literate today means not just being able to read, but being able to understand the massive amount of information thrown at us every day – much of it on the computer. Statistics is the science of making effective use of numerical data. It deals with all aspects of data, including the collection, analysis and interpretation of data. However, it can be easily misinterpreted and manipulated if we don’t do it carefully. As Mark Twain said
“There are lies, damned lies, and statistics.”
Percentage
Percentage is the most frequently used concept in business analytics because of many uncertainties in today’s complex business environment. But many times people use it without really understanding its meaning.

Percentage is a relative terminology. It is always important to ask “percentage of what” as shown in this simple example.
… of what?
Pay: $10,000 per month.
“Sorry guys. You have to have a 10% pay cut.”
Pay: $9,000 per month.
“Now I can give you a 10% pay rise.”
Pay: $9,900 per month.
What does “60% sure or confidence” mean? This is about probability. If we flip a coin 100 times and see the head 60 times, then we could say that we are 60% sure that next toss will show a head. If someone says “I have 60% confidence that this campaign will increase sales”, the statistical meaning is that if a decision maker can try 100 times under current business environment, s/he may see a sales increase for 60 times.
Question 1:
There are 3 sequences (each of them has 10 symbols with 6 Xs and 4 Os):
OXXOXOXOXX
XXOXOOXXXO
XOXXOXOXOX
Predict the next symbol for those 3 sequences
1-O, 2-X, 3-O
1-X, 2-X, 3-X
1-O, 2-O, 3-O
1-X, 2-O, 3-X
[2]:
hide_answer()
[2]:
B is correct.
An psychology experiment gives subjects a random series of Xs and Os and asks them to predict what the next one will be. For instance, they may see:
OXXOXOXOXOXXOOXXOXOXXXOXX
Most people realize that there are slightly more Xs than Os — if you count, you’ll see it’s 60 percent Xs, 40 percent Os — so they guess X most of the time, but throw in some Os to reflect that balance.
However, if you want to maximize your chances of a correct prediction, you would always choose X. Then you would be right 60 percent of the time.
If you randomize 60/40, as most participants do, your prediction ends up being correct 52 percent of the time [Sixty percent of the time you choose X and are correct 60 percent of the time, while 40 percent of the time you choose O and are correct only 40 percent of the time. On average, this is \(0.6^2 + 0.4^2 = 0.52\)], only slightly better than if you had not bothered to assess relative frequencies of Xs and Os and instead just guessed one or the other (50/50).
Question 2:
The chance a baby will be a boy (or girl) is 50%. There are two hospitals:
A - 45 births per day
B - 15 births per day
Which hospital would have more days when 60% or more of the babies born are boys?
Hospital A
Hospital B
Equal chance
Uncertain
[3]:
hide_answer()
[3]:
B is correct.
The smaller hospital is correct because the larger the number of events (in this case, births), the likelier each daily outcome will be close to the average (in this case, 50 percent).
To see how this works, imagine you are flipping coins. You are more likely to get heads every time if you flip five coins than if you flip fifty coins.
Thus, the smaller hospital — precisely because it has fewer births — is more likely to have more extreme outcomes away from the average.
Average
If you were a real-estate agent and trying to convince people to move into a particular neighborhood. You could, with perfect honesty and “truthfulness” tell different people that the average income in the neighborhood is: a), b) or c).

because we have mean, median and mode to characterize the central tendency.

Data Visualization
If your goal is to lie, cheat, manipulate, or mislead, Graphical Displays are your friend…

Example 1:

Example 2:

Example 3:

Example 4:

As “Statistics is the art of never having to say you’re wrong”, I would like to recommend a book

Case: NYC Parking Violation
We consider packing violation data in NYC from August 2013 to June 2014. The dataset is available in NYC Open Data. The website NYC Open Data is a collection of 750 New York City public datasets made available by city agencies and organizations.
The original dataset has 9.1M rows and 43 columns with size more than 1G. The dataset used in this note is already filtered with only hydrant paking violations. The excel file can be downloaded from this link.
[4]:
# load python packages and data
import pandas as pd
import matplotlib.pyplot as plt
from IPython.display import IFrame

dataurl = 'https://raw.githubusercontent.com/ming-zhao/Business-Analytics/master/data/regression/'
df_park = pd.read_csv(dataurl+'Parking_Violations.csv', parse_dates=['Time'])

# run pivot table
df_pivot = df_park[(df_park['Street Code1']!=0) &\
                   (df_park['Street Code2']!=0) &\
                   (df_park['Street Code2']!=0)].pivot_table(values='Summons Number',
                                                  index='Address',
                                                  margins=False,
                                                  aggfunc='count').sort_values(by='Summons Number',
                                                                               ascending=False).head(10)
df_pivot['ticket'] = df_pivot['Summons Number']
df_pivot['fine'] = df_pivot['ticket']*115
df_pivot = df_pivot.drop(['Summons Number'], axis=1)

toggle()
[4]:
Show the first 5 rows of the dataset
[5]:
df_park.head()
[5]:
| Summons Number | Registration State | Issue Date | Vehicle Body Type | Street Code1 | Street Code2 | Street Code3 | Vehicle Make | Violation Time | Violation County | Vehicle Color | Vehicle Year | Time | Address | |
|---|---|---|---|---|---|---|---|---|---|---|---|---|---|---|
| 0 | 1356906515 | NY | 9/18/1971 | SDN | 13610 | 37270 | 37290 | MAZDA | 0914P | NY | BLK | 2010 | 9:14 PM | 4165 BROADWAY |
| 1 | 1365454538 | NY | 2/12/1976 | VAN | 37290 | 10740 | 10940 | TOYOT | 0458A | Q | BLK | 2007 | 4:58 AM | 49-11 BROADWAY |
| 2 | 1355329360 | NY | 12/9/1990 | SUBN | 35290 | 31240 | 31290 | FORD | 0902A | Q | BK | 2003 | 9:02 AM | 4402 BEACH CHANNEL DR |
| 3 | 1364794688 | NY | 1/12/1991 | SUBN | 27106 | 9340 | 9540 | ME/BE | 0223P | Q | SILVE | 2005 | 2:23 PM | 40-30 235 ST |
| 4 | 1357592103 | NY | 1/4/2000 | SDN | 0 | 40404 | 40404 | NISSA | 1045P | R | SILVE | 2008 | 10:45 PM | 140 LUDWIGE LANE |
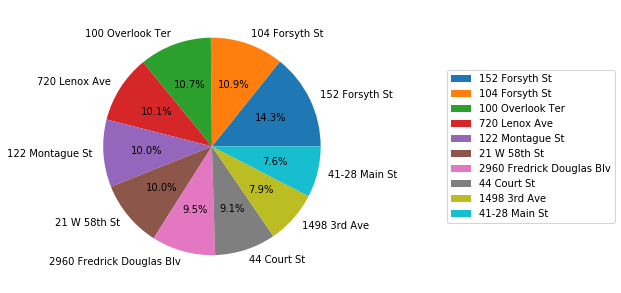
The top 10 hydrants that collect most of the tickets. Note that the fine for hydrant parking violation is $115. So the column “fine” is the revenue generated by each hydrant and the total fine of the top 10 hydrants is $144,440.
[10]:
print('Total annual revenue of top 10 hydrants', df_pivot.fine.sum())
df_pivot
Total annual revenue of top 10 hydrants
 144440
[10]:
| ticket | fine | |
|---|---|---|
| Address | ||
| 152 Forsyth St | 179 | 20585 |
| 104 Forsyth St | 137 | 15755 |
| 100 Overlook Ter | 135 | 15525 |
| 720 Lenox Ave | 127 | 14605 |
| 122 Montague St | 126 | 14490 |
| 21 W 58th St | 125 | 14375 |
| 2960 Fredrick Douglas Blv | 119 | 13685 |
| 44 Court St | 114 | 13110 |
| 1498 3rd Ave | 99 | 11385 |
| 41-28 Main St | 95 | 10925 |
[7]:
axes = df_pivot.plot.pie(y='ticket', autopct='%1.1f%%', figsize=(5, 5))
axes.legend(loc='best', bbox_to_anchor=(2,.8))
axes.set_ylabel('')
plt.show()
The most “valuable” hydrant is shown in google street view
[8]:
IFrame('https://www.google.com/maps/embed?pb=!4v1557893815788!6m8!1m7!1s_SBRnIVor2FDGiszffialA!2m2!1d40.72061441911959!2d-73.99172978854598!3f288.92!4f0!5f0.7820865974627469', width=700, height=400)
[8]:
However, according to NYC department of transportation (DOT), this may not be considered as a parking violation. 
The issue is first spotted by Ben Wellington who is the author of blog I Quant NY. It certainly has impacts on NYC DOT. Today, the google street map shows
[9]:
IFrame('https://www.google.com/maps/embed?pb=!4v1557932957501!6m8!1m7!1s04LptdatMEwvnW3J_tjGvw!2m2!1d40.72061130331954!2d-73.99171284164994!3f264.0115330665066!4f-27.9676492146982!5f0.7820865974627469', width=700, height=400)
[9]: